


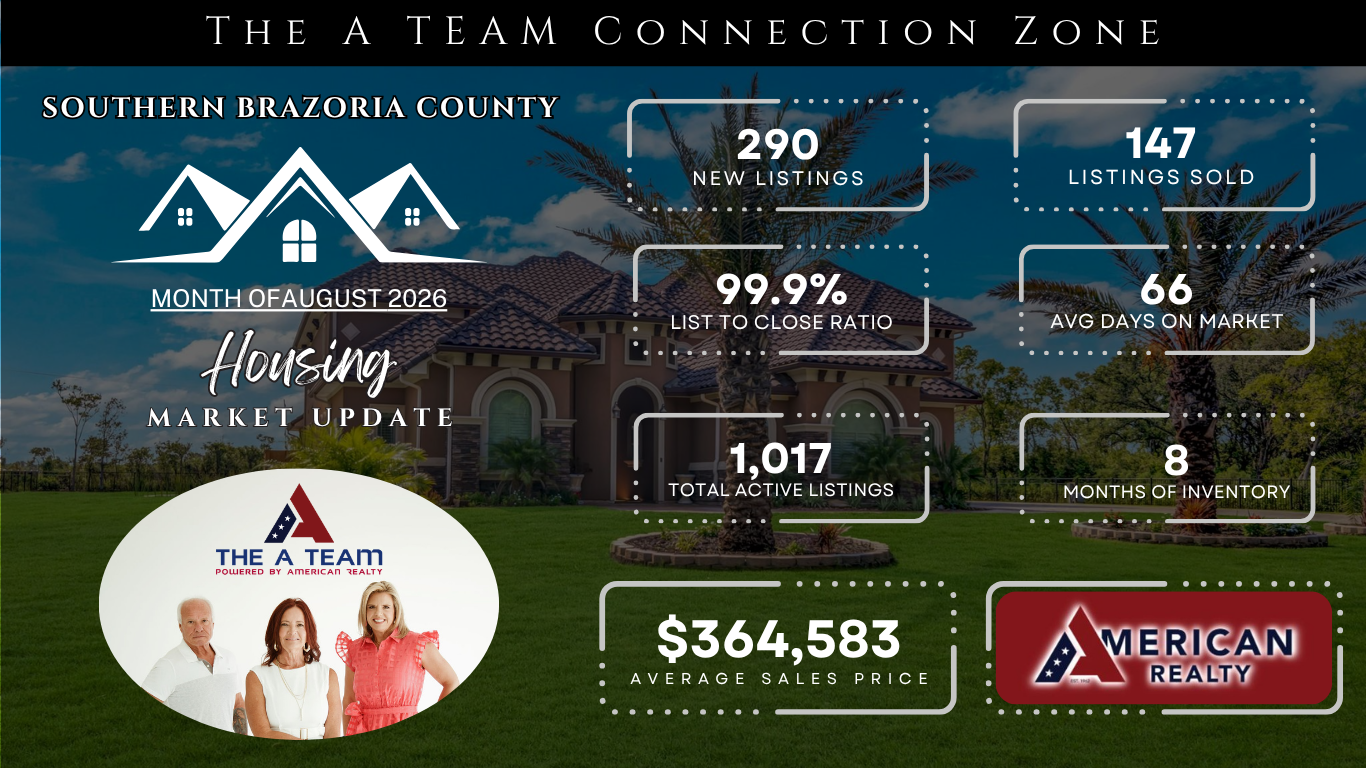
The August 2026 housing market continued to provide buyers with a substantial selection of homes while sellers faced increased competition. With 7.6 months of available inventory, proper pricing, presentation, and marketing remain important for homeowners preparing to sell.
The market data covers single-family homes in ZIP codes 77566, 77531, 77541, 77515, 77480, 77422, 77534, 77486, and 77430. The information was compiled through September 3, 2026.
New Listings Added More Choices for Buyers
A total of 290 single-family homes included in the report entered the market during August. Of those properties, 247 were still listed as active when the data was exported on September 3.
This difference is important. Some homes listed during August had already moved into pending status or sold by the beginning of September. Therefore, 290 represents the total number of new listings identified for the month, while 247 represents the portion that remained available.
For buyers, the new inventory creates more opportunities to compare locations, property conditions, features, and prices. Buyers may have more room to evaluate their choices carefully, but desirable homes that are priced appropriately can still attract attention quickly.
August Recorded 147 Closed Sales
There were 147 closed single-family sales during August within the report’s market area.
Closed sales reflect transactions that successfully reached closing during the month. These properties may have originally been listed several weeks or months earlier, so the sold total should not be directly compared with August’s new-listing count as if both groups entered the market at the same time.
The difference between 290 new listings and 147 sales does, however, illustrate the amount of new competition entering the market relative to the number of completed transactions.
Homes Took an Average of 66 Days to Sell
Properties that closed during August spent an average of approximately 65.6 days on the market, which rounds to 66 days.
An average does not mean every home took 66 days to sell. Some properties moved much faster, while others remained available considerably longer. Pricing, condition, location, financing requirements, property features, and buyer demand can all affect an individual home’s marketing time.
Sellers should also remember that days on market can influence buyer perception. A thoughtful pricing strategy at the beginning of the listing period may help a property compete more effectively than starting too high and making repeated reductions later.
Active Inventory Reached 1,017 Homes
As of September 3, the inventory report showed 1,017 active single-family listings. The average price among those active listings was $364,583.
This figure describes the homes currently being offered for sale. It should not be interpreted as the average amount buyers paid for homes during August.
A large number of available properties gives buyers more choices, but it also means sellers must compete for attention. Professional photography, accurate property information, strong presentation, convenient showing access, and pricing supported by recent comparable sales can all affect how a listing performs.
Months of Inventory Stood at 7.6
The market had 7.6 months of inventory as of September 3.
Months of inventory estimates how long it could take to sell the current supply of active homes if properties continued selling at the recent rate and no additional listings entered the market. It is a broad market indicator, not a prediction for an individual property.
At 7.6 months, buyers generally have more selection and may feel less pressure than they would in a market with limited inventory. Sellers should be prepared for buyers to compare several properties and pay close attention to condition, updates, and overall value.
Lake Jackson Sellers Received 99.9% of List Price
For ZIP code 77566 specifically, the August close-price-to-list-price ratio was 99.9%.
This means that, on average, homes included in that data closed very close to their reported list prices. It does not mean every seller received 99.9% of the original asking price. The file reports a close-price-to-list-price ratio, and individual results may differ based on price changes, concessions, repairs, property condition, and contract terms.
The 99.9% figure is encouraging for Lake Jackson sellers, but it should not be interpreted to mean that buyers will accept any asking price. The homes that reach closing may represent properties that were ultimately positioned appropriately for the market.
What This Market Means for Buyers and Sellers
Buyers currently have a meaningful selection of homes and may have time to compare their options. However, well-priced properties can still move quickly, so buyers should have financing arranged and understand their priorities before finding the right home.
Sellers are competing with more than 1,000 active listings across the report’s market area. A successful strategy should be based on recent comparable sales, competing active listings, property condition, and current buyer activity.
Market-wide averages provide useful context, but real estate conditions can vary considerably by neighborhood, price range, property type, and condition. A property-specific market analysis remains the best way to understand how an individual home may compete.